We asked 6,000 Americans how they actually decide they've made it. The answer has almost nothing to do with a balance, and almost everything to do with what it cost them to get there. Every cut of the data is here, exportable, and attached to a spokesperson who can talk about it.

—
—
—
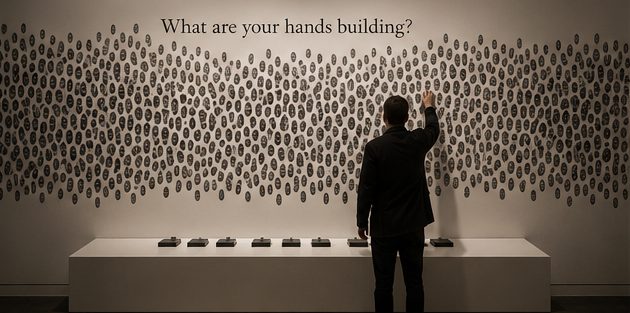
An exhibition of hand casts and close-up photography — plumbers, surgeons, athletes, founders, welders — each paired with the financial number they hit the day they made it. No faces. No golf courses. No boats. The first wealth campaign built entirely on the physical evidence of labor.
Opening 2026 · admission free · new casts added in every city.
Cracked knuckles, a surgeon's steady fingers, a pitcher's scarred throwing hand. Each cast paired with a one-line story and a number.
Every visitor leaves a fingerprint. By closing week the wall holds several thousand of them, and no two days look the same.
A pipefitter, a NICU nurse, a farrier, a relief pitcher, a line cook who opened her own room. Each cast paired with one sentence and one number.
The financial industry has spent fifty years building instruments to answer one question: am I going to be okay? Scores. Projections. Dashboards that turn green. Monte Carlo simulations run ten thousand times to produce a percentage.
What almost nobody has measured is whether any of it works — whether the people on the other side of those dashboards actually feel any different. This study measures that, and the answer is no.
Readiness turns out not to be a threshold people cross. It's a feeling people either have or don't, and it correlates far more tightly with what their work cost them than with what their portfolio is worth. That is a different story than the one the category has been telling, and it is a story with data behind it.
"No calculator built what you built. No formula worked the hours you worked."
Ready Isn't a Number · Mariner · 2026
Pick a generation, a net-worth band, a kind of work and a gender. Each cut returns a headline number, a citable quote, and one-click export. Options that would leave too few respondents to report are struck through before you click them.
—
—
Ready Isn't a Number · illustrative
Choose a question from the study and a dimension to break it out by. Your filters above still apply to every other dimension.
Five findings from the first edition, each with the chart and the base sizes behind it.
The study's sharpest divisions aren't by wealth — they're by what someone does all day. Drill into each, with a downloadable cut for every segment.
Ask a plain-language question and get a grounded, sourced answer drawn only from this study — the same structured data an assistant would surface when someone asks whether they're financially ready.
Five spokespeople across Mariner's investment, advice and client-facing teams. Requests reach the communications team directly, with the cut of the data you're viewing attached.
Each with the figures behind it and the person at Mariner closest to it.
Findings, charts, methodology, spokespeople and the full respondent file. No form, no gate, no email required.
Use of the data is free with attribution. On first reference:
Charts may be reproduced as exported, including the base size shown. Subsequent references may shorten to the Mariner readiness study. Every figure carries its own n and margin of error — please keep them attached when quoting a subgroup.
Need a cut that isn't here — a region, a metro, an occupation we didn't break out? Ask, and we'll run it.
Spokespeople available on 48 hours' notice; on-site interviews bookable at the exhibit. Placeholder contacts — demo purposes.
Every chart is exportable as PNG or CSV via its "Use this" bar, with a citable quote and an embed snippet.
Forty-four pages of cross-tabs, methodology and analysis — the complete first edition, formatted for citation.
No spam. Illustrative demo — nothing is submitted or stored.
The study segments illustrative attitudes toward financial readiness across four axes — generational cohort, investable net worth, kind of work, and gender — for a field period ending May 2026.
Every figure derives from a single internally consistent respondent-level file: subgroup percentages reconcile against the topline in every view, "all" rollups are true weighted combinations of their parts, and no cut is displayed without its own base size and margin of error printed beside it.
—
Ready Isn't a Number is a concept developed by Vested for Mariner. All data shown is illustrative and synthetic, created to demonstrate the format and storytelling potential of the study.
No survey was fielded. No figure on this page was measured. The data was generated from a directional model so that every cut behaves the way real survey data behaves — but nothing here should be reported as fact, quoted to a reporter, or used externally.
Spokesperson names are real Mariner executives; their platforms and topics are proposed, not approved.
In a live version this would have emailed Mariner's communications team — your name, outlet, deadline, the spokesperson you asked for, and the exact cut of the data you were looking at when you asked. Someone would come back to you inside one business day.